The DASH course has not been an issue here on Bitcoin-Bude for a long time. However, there is currently a good reason to change that!
Because what is shown on the DASH chart is definitely promising. What’s more, it’s a chart that’s begging for a price rally, and it could be tough. We are talking about around 300% or even significantly more!
Sounds interesting? I think so too.
So let’s get to work together and dive into a DASH forecast that bodes rosy for the altcoin in the coming weeks.
As always, the disclaimer applies that everything I publish corresponds to my personal and honest assessment and in no case represents a trading recommendation.
After that has been brought to the stage in the usual jargon, we can finally continue with the analysis of the altcoin. Have fun reading!
DASH Course in Elliott Wave Analysis
The DASH course has lost a lot of feathers in the last almost 300 days. On May 7, 2021, it was still sitting at its high of over $475. Ten months later, the price is only around $90.
This is undoubtedly a very painful correction, but it is anything but unusual for cryptocurrencies. And yes, we are talking about a correction despite a price loss of more than 80%, even if it is of course an extremely painful downward trend for investors in the medium term.
But enough of the preamble, let’s take a look at the chart together.
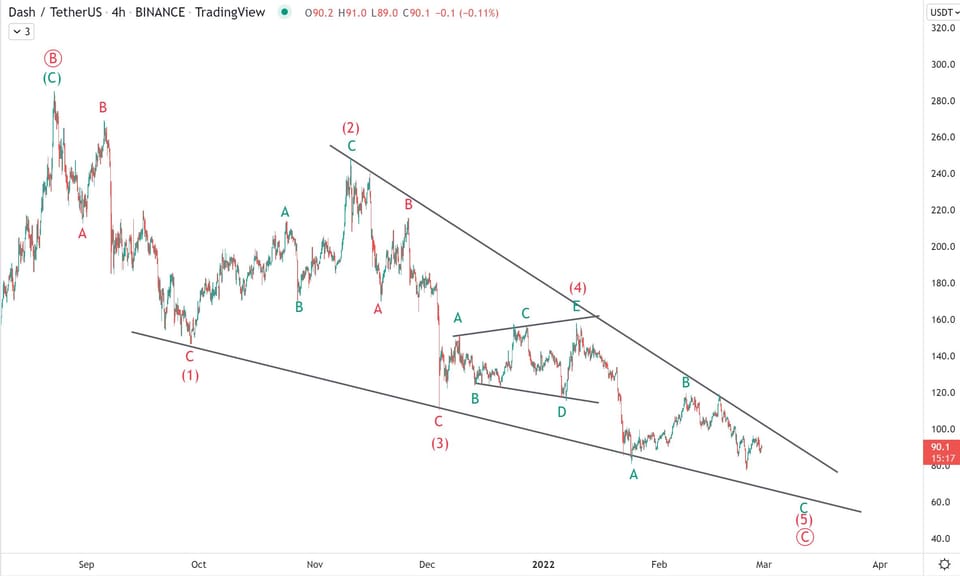
As the chart shows, I believe the DASH price is at the end of a ZigZag corrective move that runs from the beginning of the wave Ⓐ to the supposed end of the wave Ⓒ . Wave Ⓒ is formed as an ending diagonal, which we want to take a closer look at below.
To do this, we zoom in from the daily chart to the 4-hour chart. This allows us to take a closer look at the course structure. What this shows is the typical CCCCC structure of an ending diagonal with an expanding triangle in the wave (4).

At the same time, the chart shows that according to my primary wave count, wave (5) is not over yet. This shows a smaller ZigZag structure, with one last move down to the lower trend line. Accordingly, in this scenario there is a short-term target price of around $60 for the DASH course.
This could still represent another correction of 33% at the current price. I am also pricing in my primary scenario for the Bitcoin price here , in which further downside potential could be expected.
DASH forecast of $247 or more
According to Handelskontor-News, the DASH Coin is particularly interesting for investors who attach great importance to data protection and anonymity. Due to the current setup, the altcoin could also be interesting for any investor who is looking for lucrative increases in value. So that should apply to pretty much everyone and, above all, also includes active traders.
It becomes particularly interesting for the DASH course when the correction structure in the form of the ending diagonal is completed. It is also not given that the approximately $ 60 will be reached at all.
But what is given to us by a completion of the Ending Diagonal in the larger context is a completed ZigZag movement in the overall Ⓐ , Ⓑ , Ⓒ structure. So what we can expect next from this is a significant rally. It may even initiate the beginning of a new impulse wave in the overall trend.
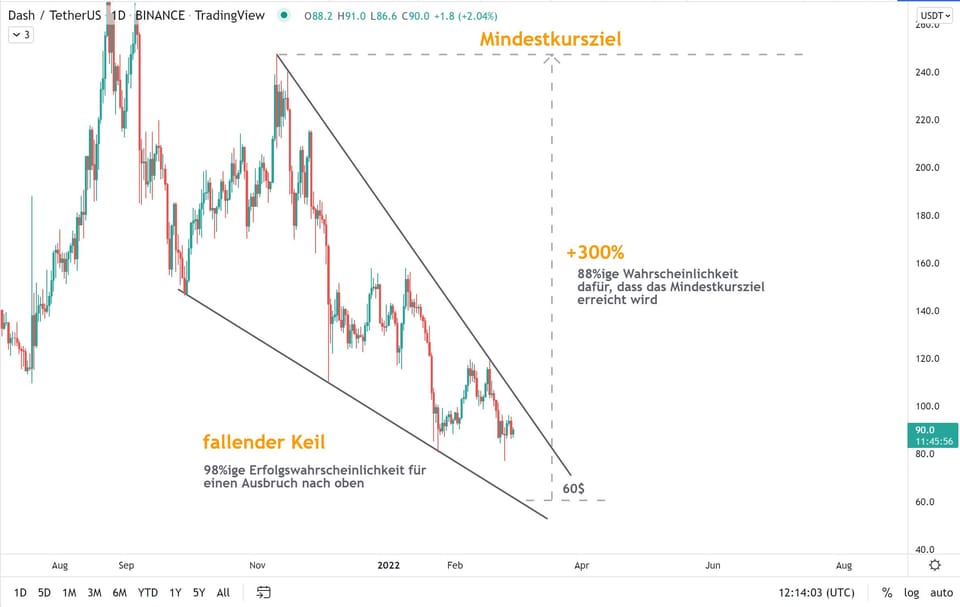
Theoretically, of course, a more complex correction structure could also develop. But even in this case, we can expect a countermovement in an X wave. The chart formation, which is referred to as a falling wedge in traditional chart analysis , also says that it has a high probability of becoming significant.
I already addressed the falling wedge formation as a course pattern in my last AAVE forecast. It is their statistical reliability that makes such a setup particularly worthwhile. According to Bulkowski’s evaluations, a falling wedge has an error rate of just 2%, while the minimum price target is reached or even exceeded in 88% of cases.
The minimum price target is calculated by the highest point within the chart pattern. With the DASH course, this minimum course target is around $247. Should the price actually drop again to $60 before this expected price rally, this would correspond to a more than 300% strong upward rally.

Those are florid prospects resulting from this DASH forecast – no doubt about it! But it should also be clear to everyone that nothing is ever 100% definite. However, the statistical data speak a clear language here.

